 JuicyTalk
Bitcoin (BTC) circled $73,500 on Sunday as bulls stared down 3% BTC price losses for May.
Key points:
- Bitcoin looks set to end May “in the red” as the monthly candle close nears.
- US labor-market data will form the key volatility catalyst for risk assets next week.
- Bitcoin analysis says that $73,000 is the key line to watch for the monthly close.
Bitcoin eyes “red” May ahead of key US PMI data
Data from TradingView followed a quiet weekend for BTC/USD, which remained wedged under 2025 yearly lows.
BTC/USD one-hour chart. Source: Cointelegraph/TradingView
US stocks finished the week with new all-time highs, but Bitcoin failed to catch a tailwind from easing geopolitical tensions, notably progress on a US-Iran ceasefire.
Commenting on X, trading resource The Kobeissi Letter quoted US President Donald Trump as saying that he was “in no hurry” to get an Iran deal finalized.
Looking ahead, it added, the coming week would be “all about the labor market,” with US employment data forming a potential source of crypto and risk-asset volatility.
That would include the May print of the Institute for Supply Management (ISM) Manufacturing Purchasing Managers’ Index (PMI) — a yardstick for economic output that offered BTC price action some relief in recent months.
“If bitcoin still continues to follow growth & risk appetite, it needs to reprice higher from here IMO,” Andre Dragosch, European head of research at crypto asset manager Bitwise, argued on X following recent PMI data.
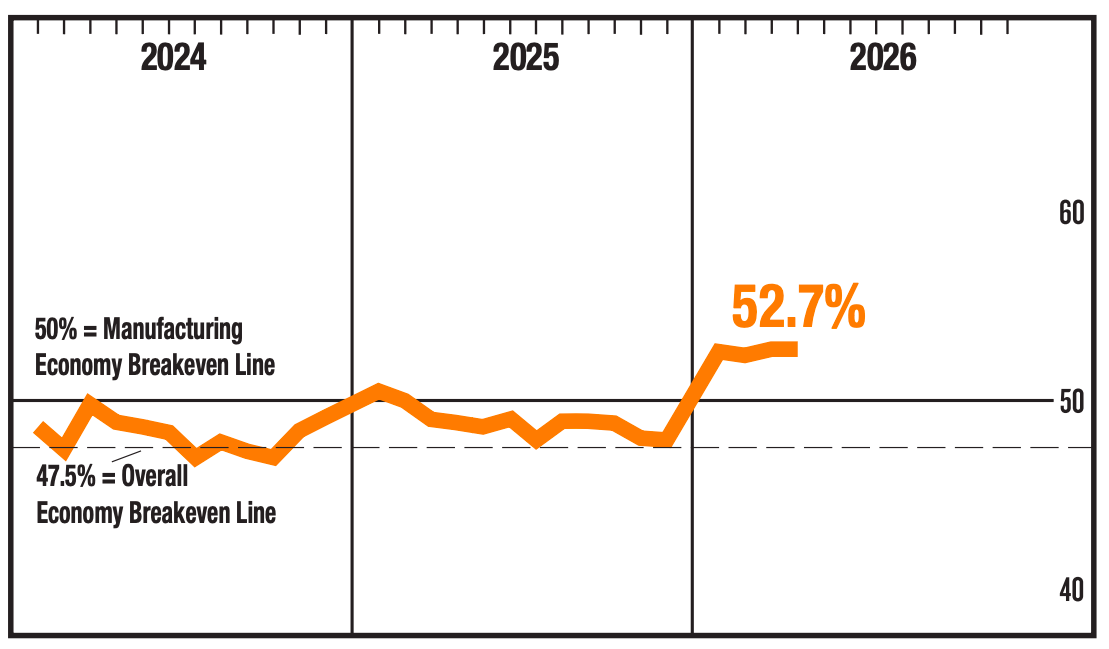
US manufacturing PMI data (screenshot). Source: ISM
Analyst hopes for BTC price monthly close above $73,000
With BTC/USD down by just over 3% month-to-date, per data from CoinGlass, traders were mostly unimpressed.
Related: Bitcoin analysis eyes sharp rebound after BTC collapses below M2 supply ‘fair value’
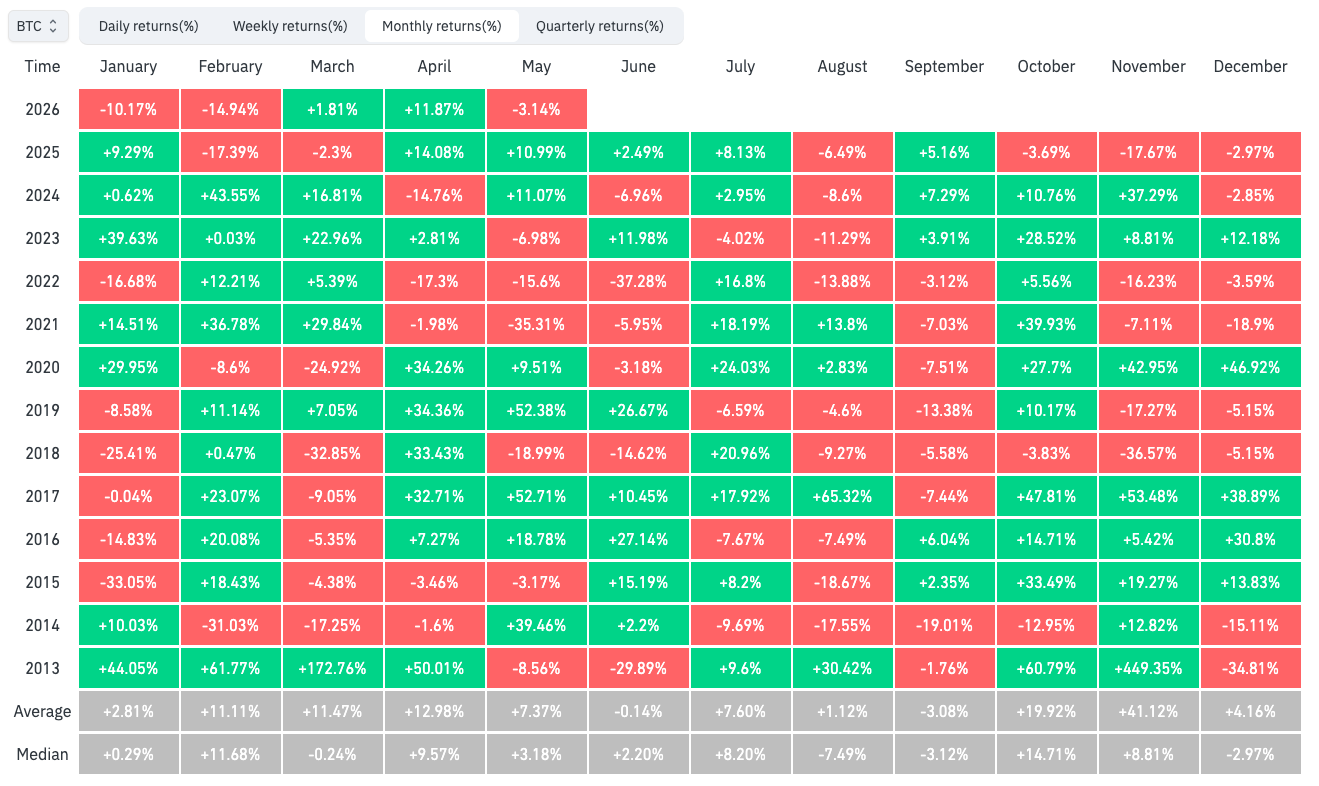
BTC/USD monthly returns (screenshot). Source: CoinGlass
“At the moment, the $BTC retest of $73k has been successful despite recent downside volatility,” trader and analyst Rekt Capital wrote in his latest X analysis.
“If Bitcoin manages to Weekly Close above $73k then price will be one step closer to confirming the Double Bottom breakout & be positioned to try to trend continue.”
Rekt Capital referred to a “W”-shaped bottom formation on the weekly chart that formed from late February onward.
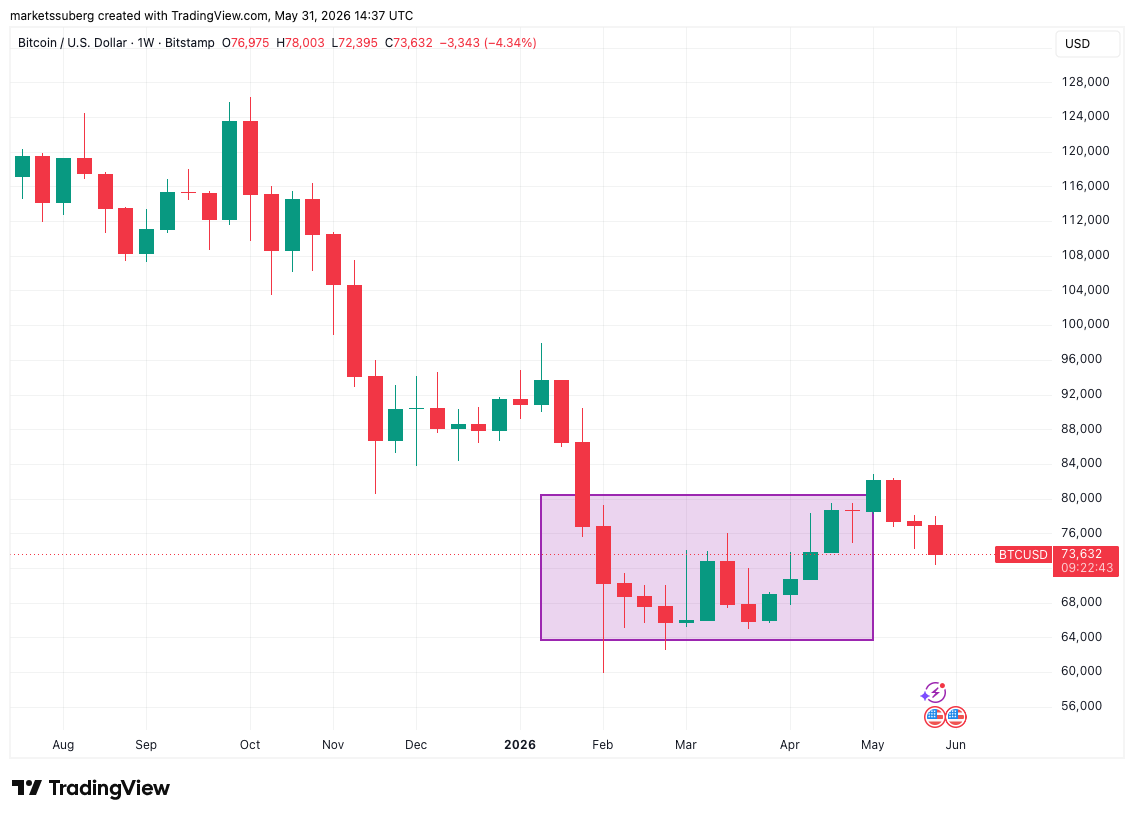
BTC/USD one-week chart with double bottom. Source: Cointelegraph/TradingView
With various key trend lines nearby, trader Daan Crypto Trades saw the macro range staying in play for the foreseeable future.
“$BTC Trading at its bull market support band after a failed retest the past few weeks. The Weekly 200MA & EMA are still moving up and closing in on price as well,” he told X followers.
“With all these big high timeframe weekly levels around this area, I would not be surprised to see us trade between $60K-$80K for quite a while.”
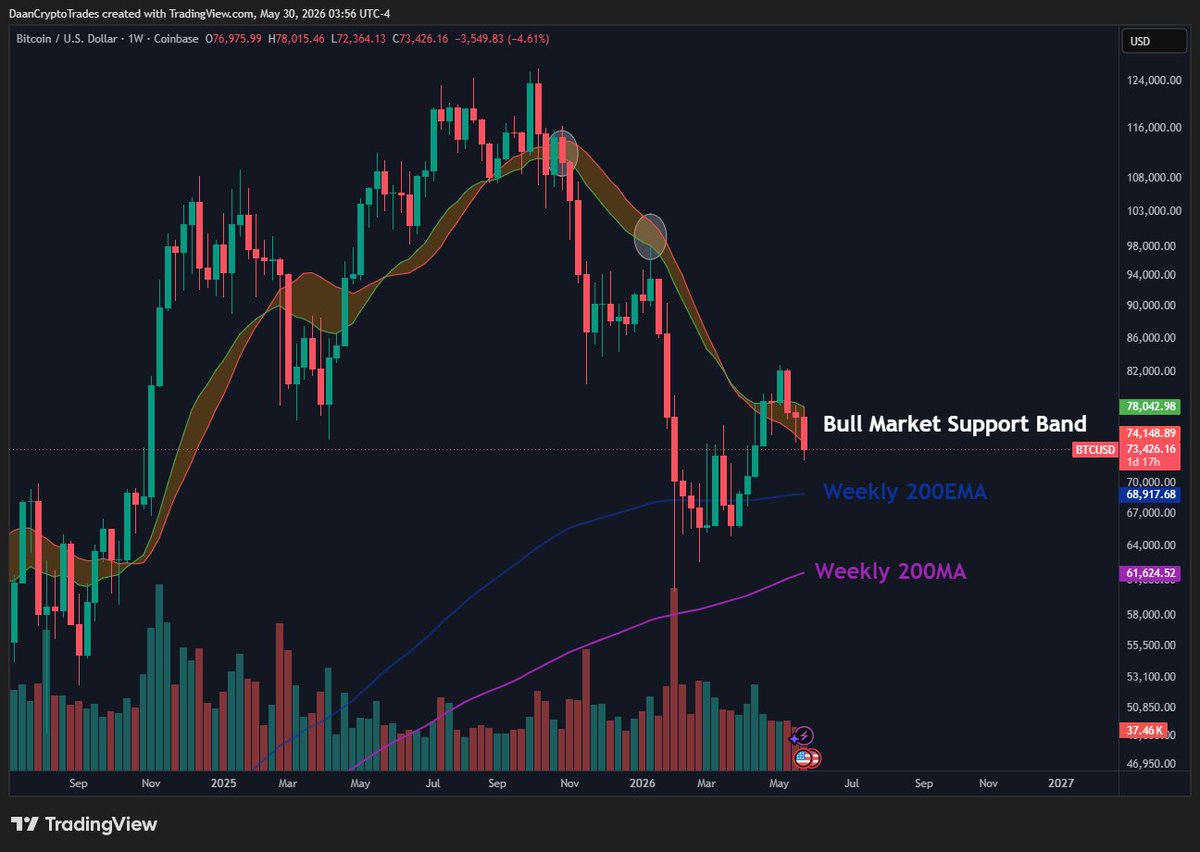
BTC/USD one-week chart. Source: Daan Crypto Trades/X
As Cointelegraph reported, the price was no longer due short-term targets formed by “gaps” in CME Group’s Bitcoin futures, with these now trading 24 hours per day.
